
Understanding your investment manager’s style may give you a deeper appreciation of how they will perform in different circumstances, and therefore help you understand the type of risk you are taking on as well as the performance potential. Curious clients often ask where we sit on the style spectrum; we prefer not to box ourselves in. Grant Pitt discusses why.
Investment style is one of the aspects of investing used to describe an investment manager’s investment philosophy and approach. In essence, the “style” determines the subset of shares a manager will consider in their stock selection process and can therefore be a useful differentiator between managers. If a manager’s style resonates with you, and you take the time to understand it, you are more likely to stay the course and benefit over the long term.
… our flexible approach enables us to take advantage of whatever types of opportunities the market presents.
But as with many things in life, labels can help, but sometimes fail to capture the full picture. People often refer to Allan Gray and Orbis as “value” managers. To unpack whether this statement holds true, and the label is relevant, we will first define “value investing” and then take a look at some of the data to see if it applies.
What is value investing?
The concept of value investing was first introduced in business schools in the 1920s by Benjamin Graham and David Dodd. Graham later went on to publish the highly acclaimed The Intelligent Investor in 1949, and today is widely considered the father of value investing. Graham suggested that investors should look for discrepancies between the market price of a share and its true intrinsic value, while providing for a margin of safety, or room for human error. He maintained that market prices are often not to be relied on given the human emotions driving those prices.
Interestingly, Graham never actually used the phrase “value investing”; the term was later coined to describe Graham’s ideas. However, as many of the early opportunities identified by Graham and Dodd were shares trading on low price-to-earnings or price-to-book valuation multiples, it has led to a misinterpretation of his principles, with most now considering value investing as investing in shares that trade on low valuation multiples.
Growth investing, in contrast, seeks to invest in shares that offer superior earnings growth potential to the average company, and which therefore often trade at an above-average valuation multiple (whether price-to-earnings, dividend yield or price-to-book metric).
Shares are … included when they offer superior expected risk-adjusted returns to the market.
How do we define our investment style?
At Allan Gray and Orbis, we consider ourselves “value-orientated” investors – very much in the Benjamin Graham mould. As Allan Gray himself noted in the June 1996 Orbis Global Equity Fund quarterly report:
“We aim to buy a participation in a business on your behalf at a market price which is well below what our research leads us to believe is its intrinsic value. This stems from our conviction that this offers the best prospect of superior returns and below average risk of loss. We favour investing in companies which we expect to experience above-average growth in earnings per share for the foreseeable future. However, we prefer not to pay ‘over the odds’ for such superior prospective growth …”
It should not come as a surprise, then, that Graham’s illustration of the “margin of safety” principle looks very similar to how we (Allan Gray and Orbis) depict our shared investment philosophy.
Although we have never limited our search to shares trading at low price-to-earnings or low price-to-book multiples, our contrarian investment philosophy naturally leads us to out-of-favour areas of the market and shares that, on average, trade at depressed multiples relative to the broader market. However, we do not limit our research to fast or slow growth, high or low quality, big or small companies, and we don’t avoid shares simply because they trade on high valuation multiples. Like Graham, we aim to identify shares that trade significantly below what we think they are truly worth today, factoring in the expected future growth potential.
What does the data reflect?
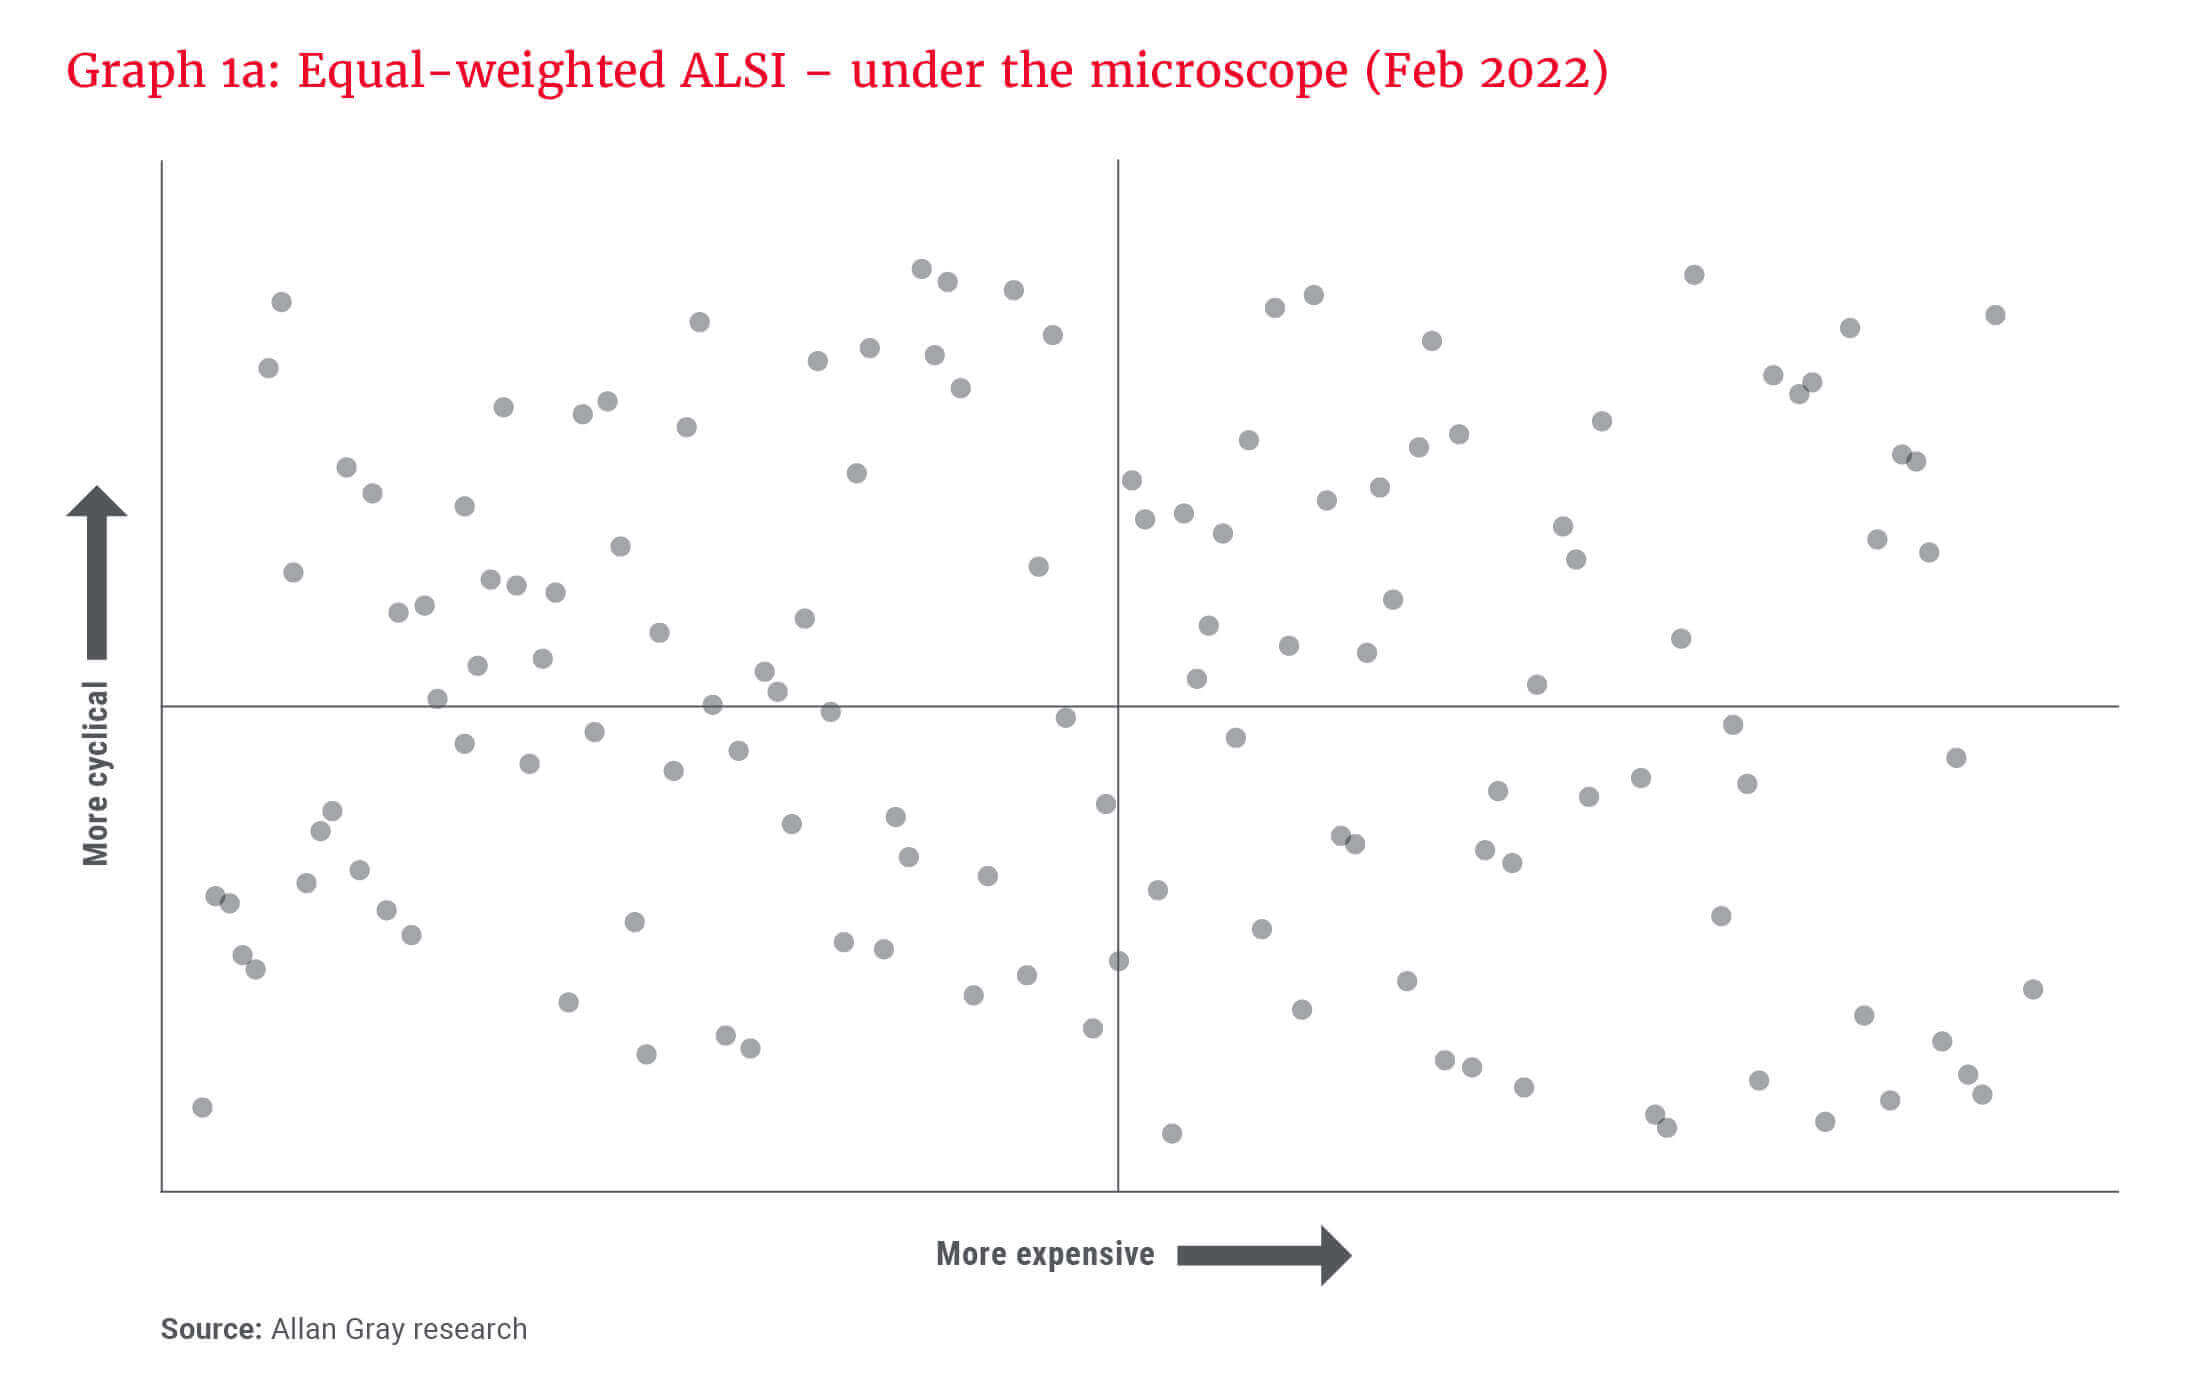
In Graphs 1a and 1b, we have classified the shares within the South African market according to their value and growth characteristics. Each circle in Graph 1a represents a constituent share on the FTSE/JSE All Share Index (ALSI) as at the end of February 2022.
Shares are classified on the horizontal axis according to their valuation – the further to the right, the more expensive they are. The vertical axis classifies shares by their cyclicality (how volatile their prices have been on a relative basis). The higher the share, the more cyclical it has been historically; the lower the share, the more defensive (having less variability in price fluctuations). As the valuations and cyclicality/defensiveness metrics are relative calculations, one would expect a relatively even distribution across the spectrum, or four quadrants, as reflected in Graph 1b.
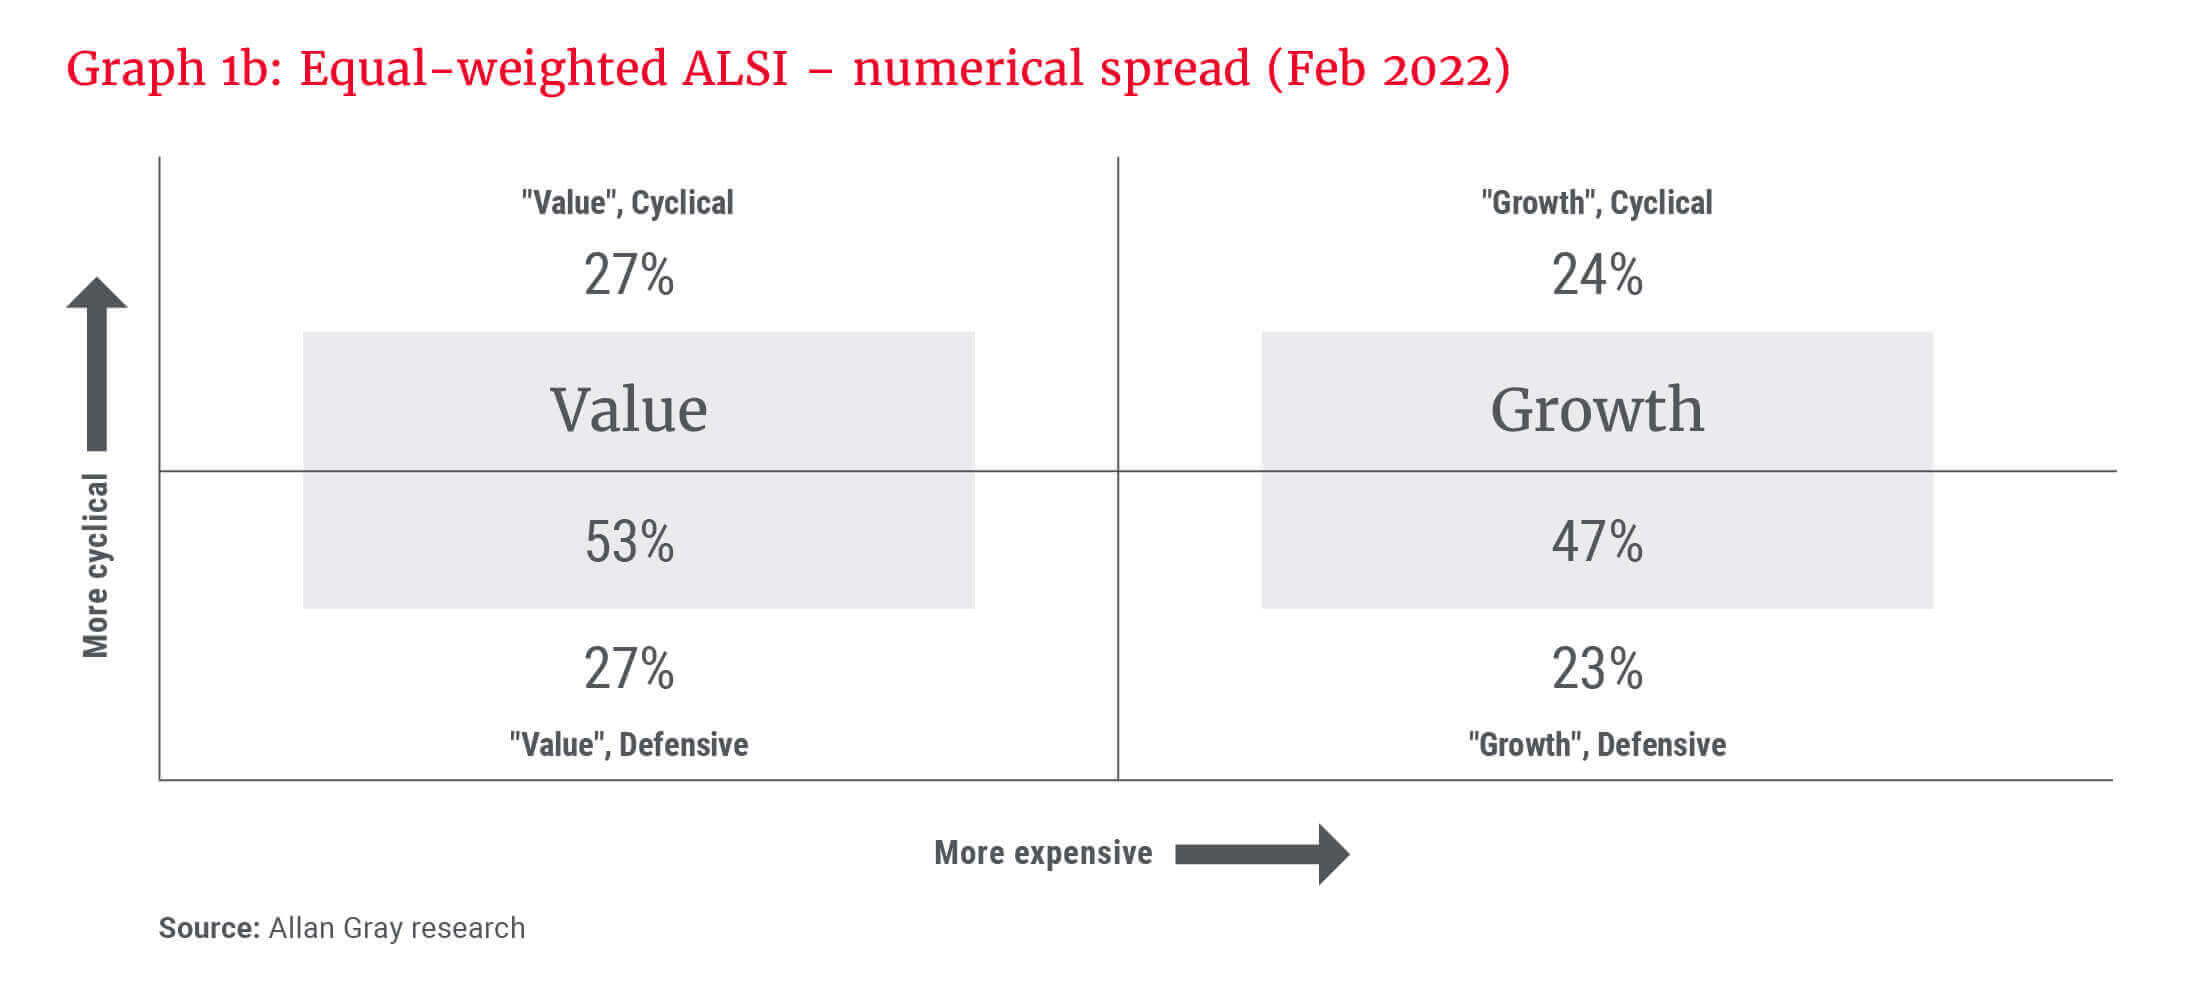
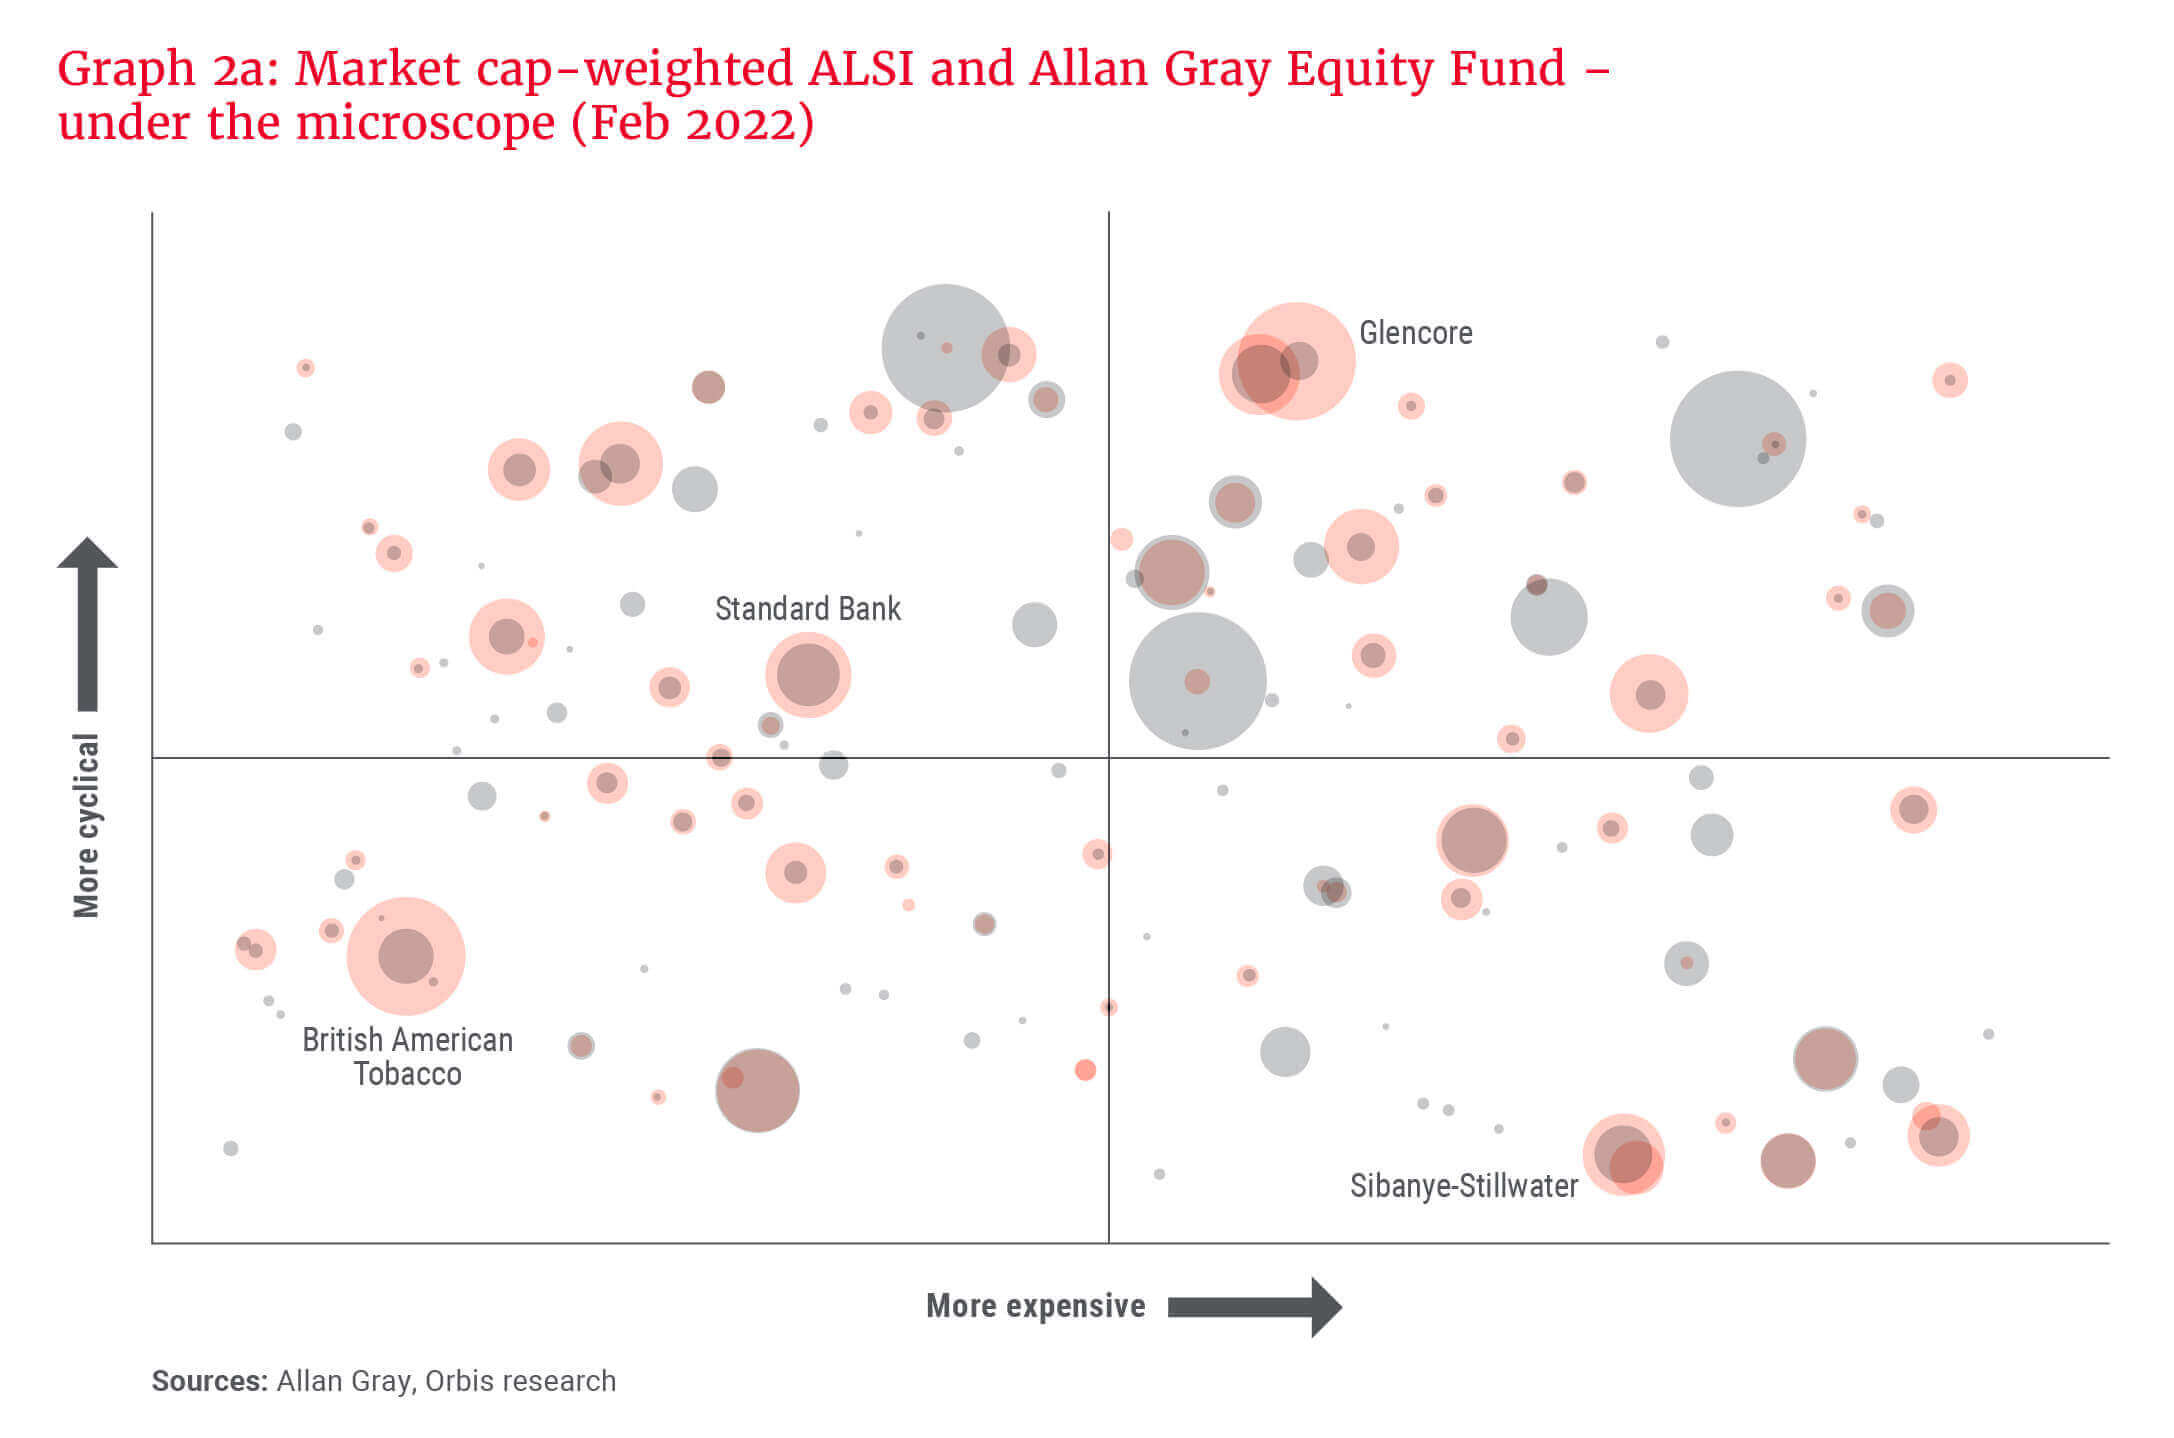
However, what Graphs 1a and 1b fail to capture is that not all constituent shares within the market carry an equal weighting. The ALSI is relatively concentrated, so accounting for the divergent market capitalisations of companies – reflected by the size of the grey bubbles in Graph 2a – the picture looks somewhat different. The local shares held within the Allan Gray Equity Fund (“the Equity Fund”) have also been included (the red bubbles) and reflect the different positioning of the Equity Fund to the market. The numerical weightings per “style” are reflected in Graph 2b – the Equity Fund in red and the ALSI in grey.
What may surprise those who think of us as a “value” manager is that growth shares actually account for more than half of the Equity Fund today (53%), while value accounts for 47%, with the distribution across the four quadrants relatively even. From a market viewpoint, growth shares represent almost two-thirds of the market (64%), with value representing only 36%.
Delving further, the Equity Fund is overweight value/defensive (+11%), marginally overweight growth/defensive (+1%), equal weight value/cyclical, and underweight growth/cyclical (-12%), despite it comprising the largest component of the Equity Fund (31%). The four largest shares in the Equity Fund as at the end of February 2022 are also highlighted, and interestingly, each falls into a different quadrant.

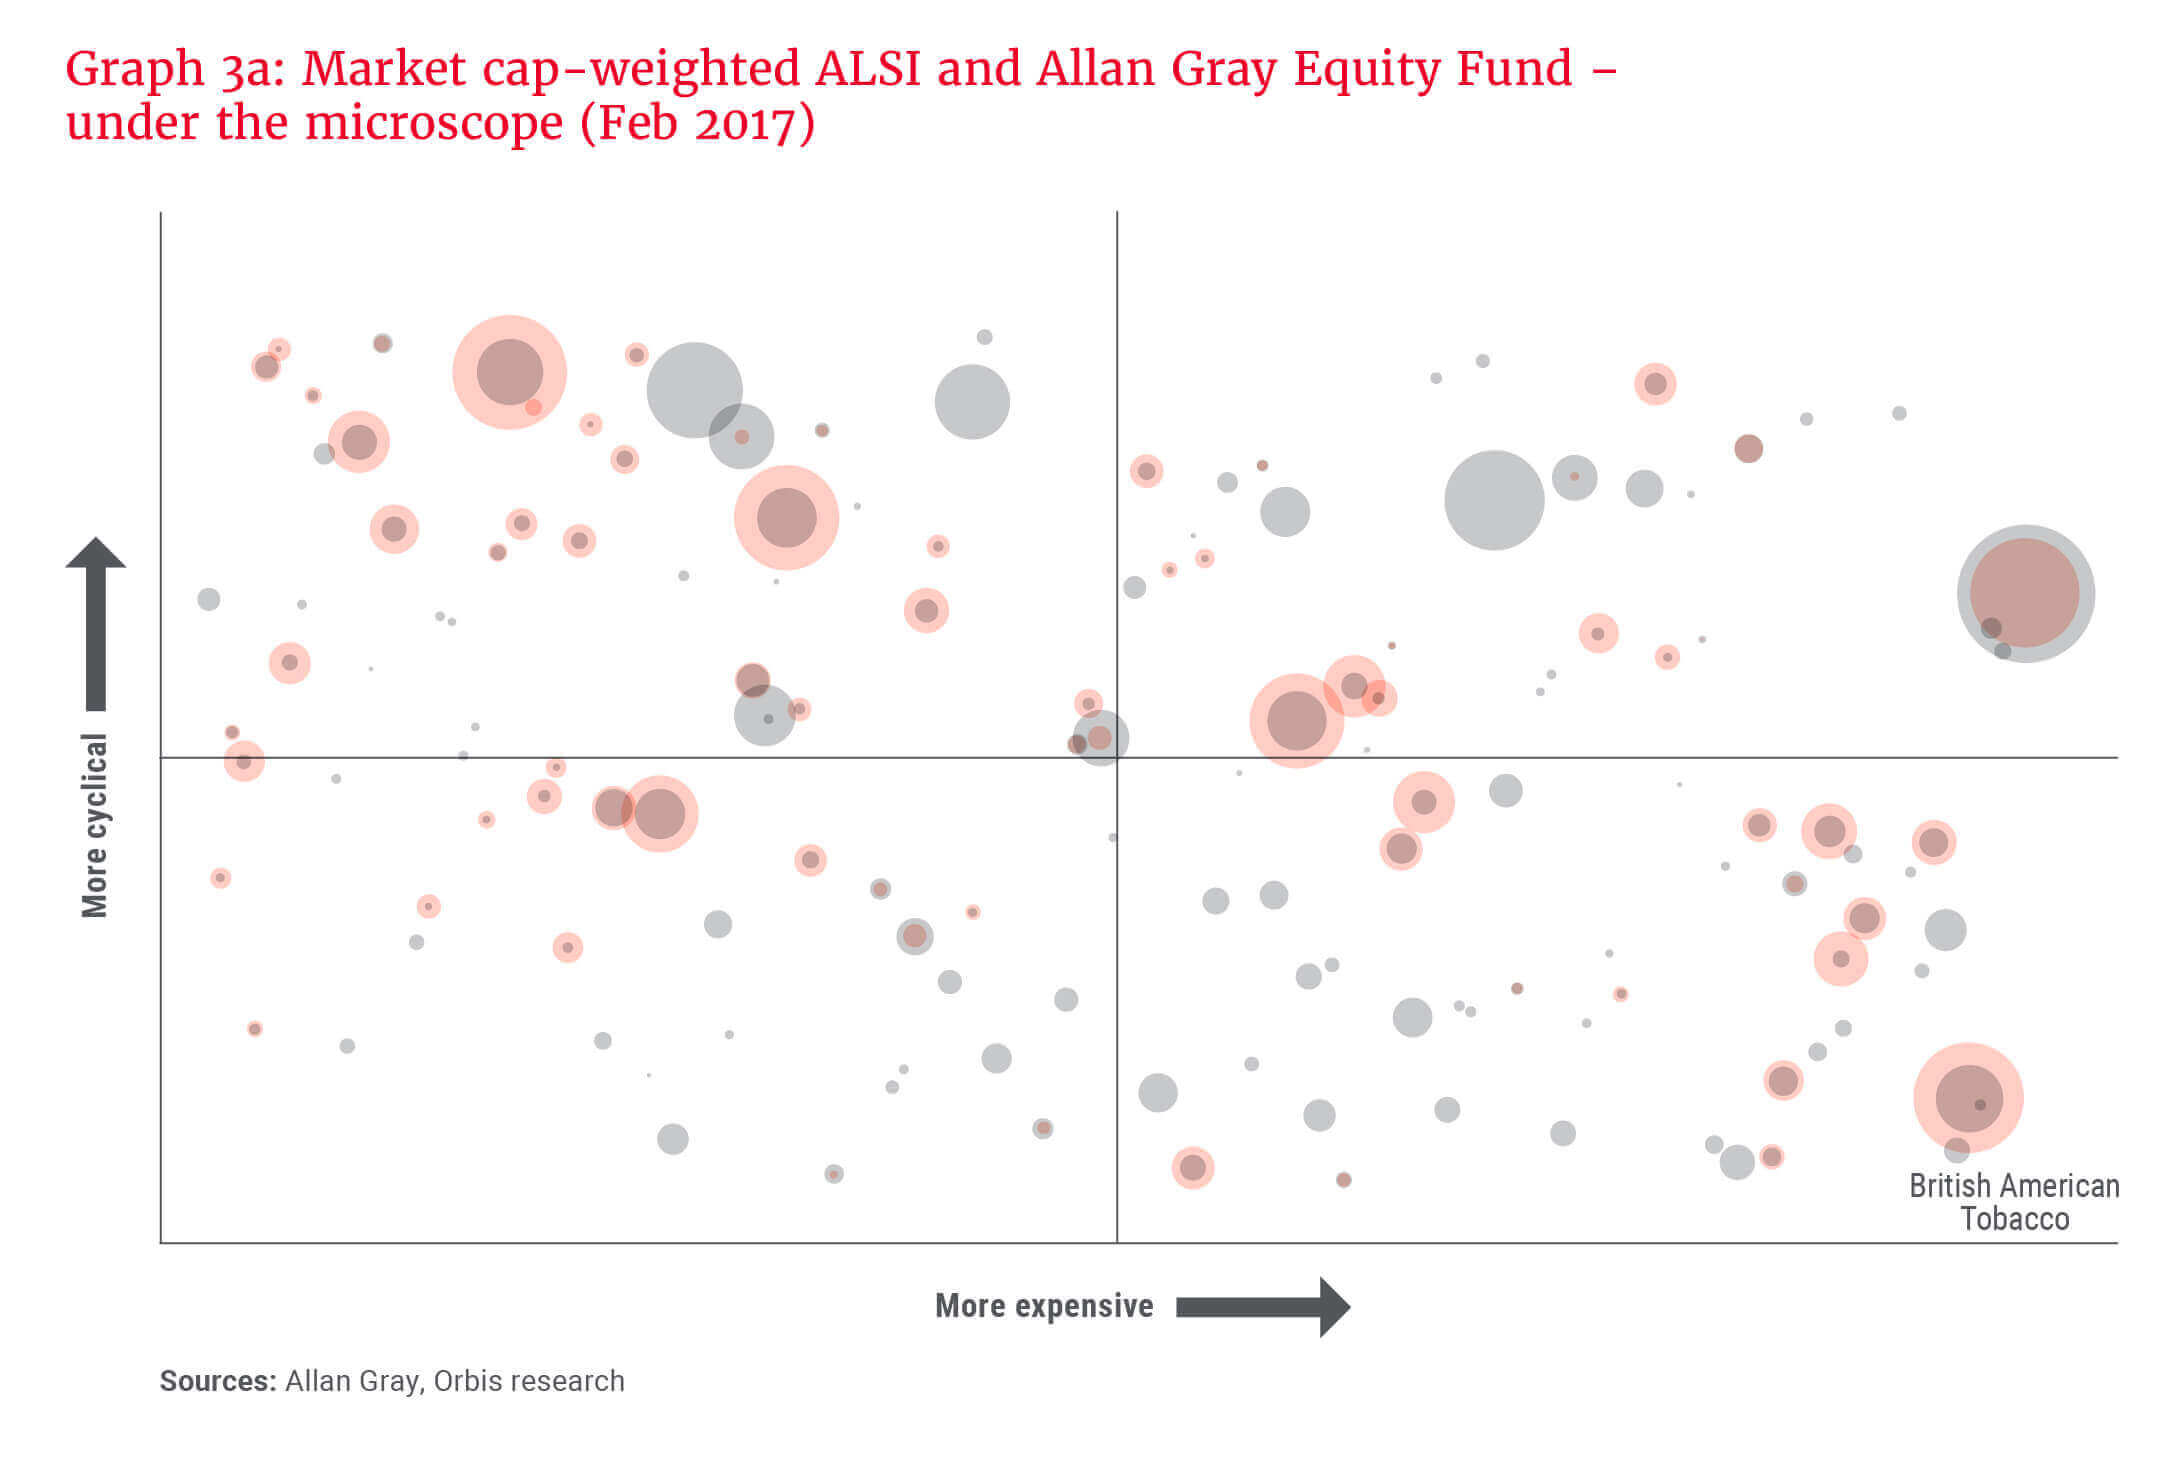
Markets are dynamic and share prices fluctuate, occasionally aggressively so, as we have witnessed in the first quarter of 2022. The relative attractiveness of shares therefore varies over time and shares can move between quadrants based on price movements. For example, British American Tobacco today is classified as value/defensive, whereas a few years ago it would have been classified as growth/defensive. One should therefore expect the exposure per quadrant to vary as the opportunity set evolves.
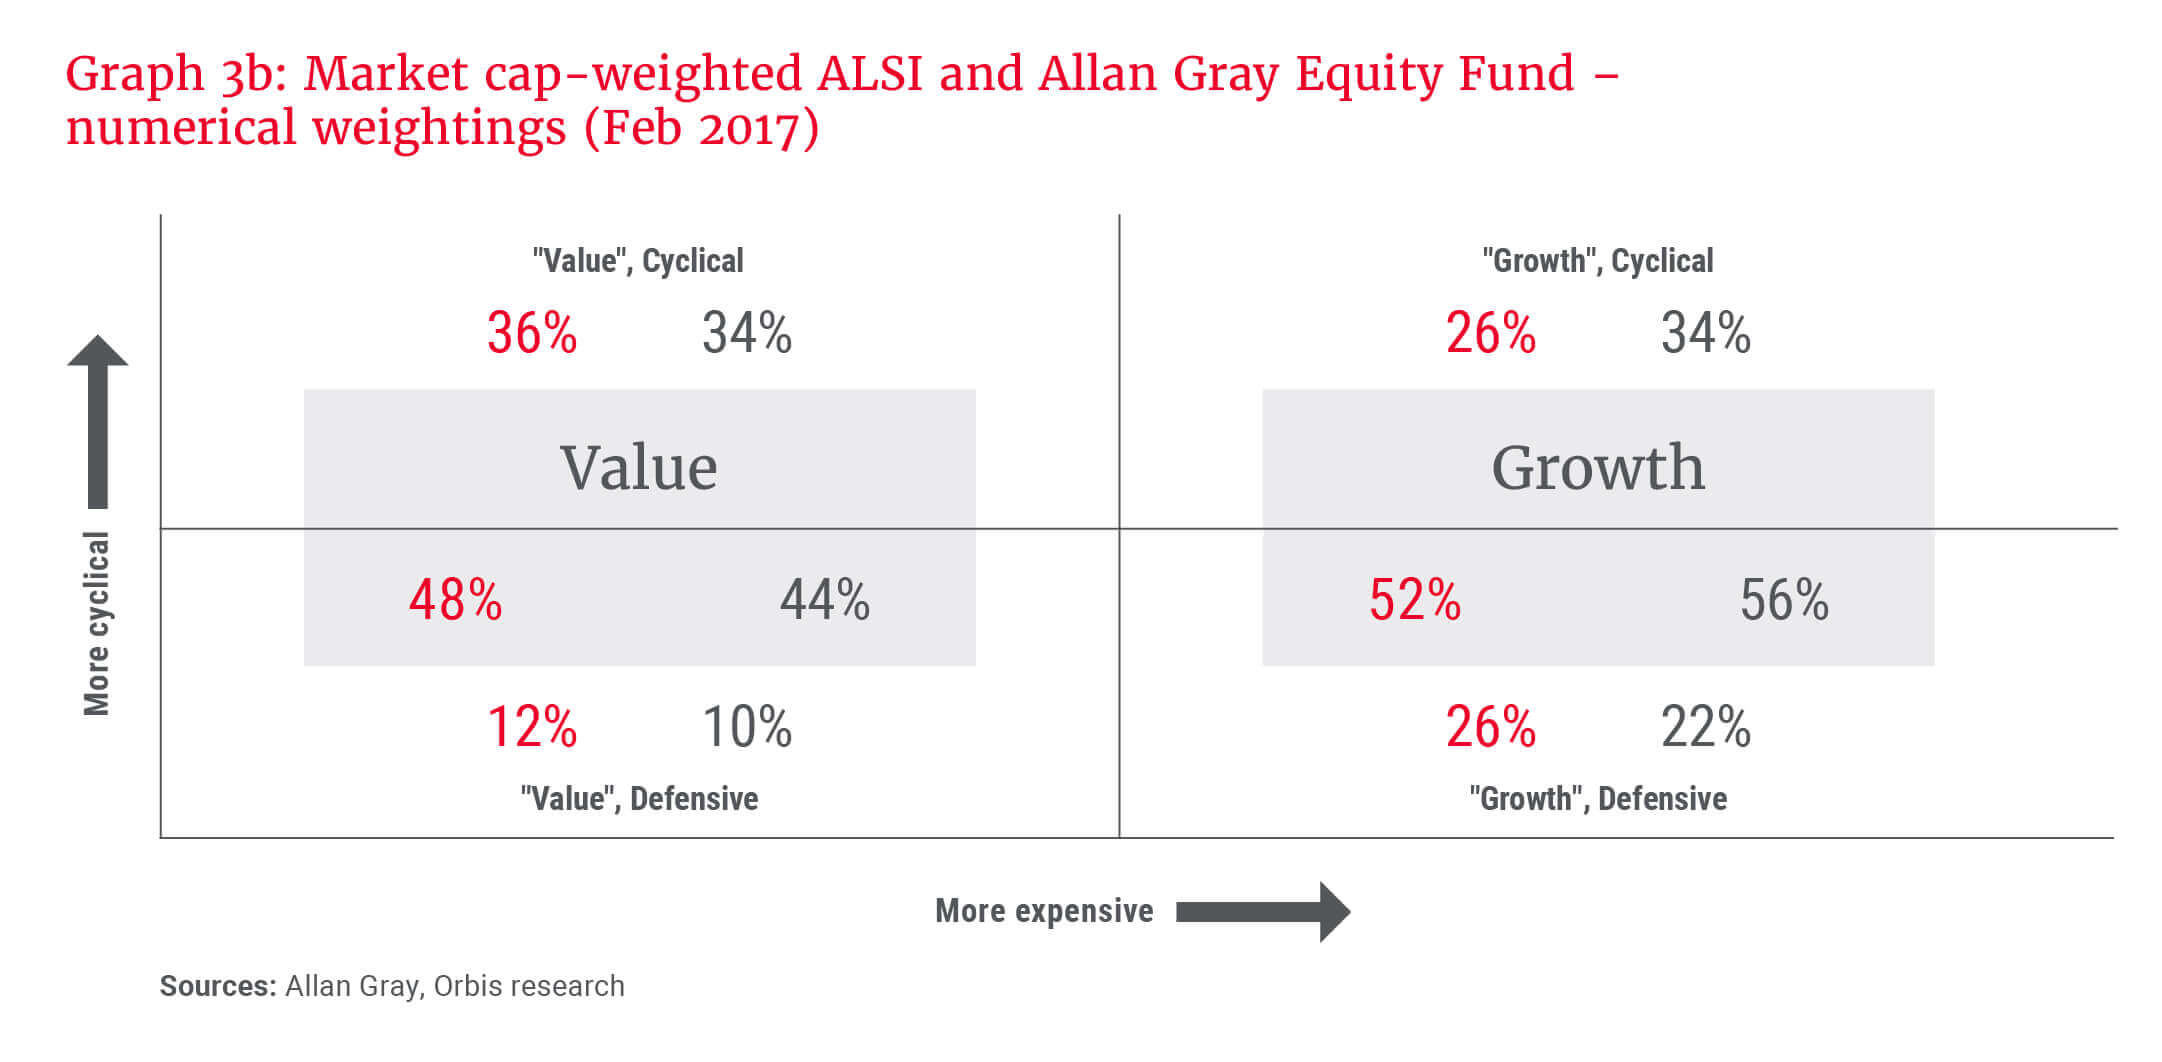
This can be seen if we consider the market five years ago, as reflected in Graphs 3a and 3b. In February 2017, there was more balance between growth and value (56% vs. 44%) than what we see today. At the time, the Equity Fund still had slightly more exposure to growth (52%) and was less overweight value relative to the market (+4% vs. +11% currently). In contrast to today, we were finding greater value in growth/defensive (+4%), fewer relative opportunities in the value/defensive bucket (+2%) and were less underweight growth/cyclical (-8%).
It is important to highlight that this historical analysis does not have any influence on how we construct portfolios. Shares are identified through our bottom-up, fundamental research process and included when they offer superior expected risk-adjusted returns to the market. If several individual opportunities are identified which happen to fit a certain style, then it is likely that the Equity Fund will have meaningful exposure to that style at a point in time.
Avoid getting tangled in the theory
While it is popular to try to distinguish between value and growth investing, we maintain that it is misleading to do so. This is partly because growth potential is one of the essential inputs required to calculate intrinsic value, and calculating intrinsic value is key to value investing.
Great investment opportunities can be found in any market environment.
Warren Buffett expressed this sentiment in his 1992 chairman’s letter, in which he made it clear that growth is always a component in the calculation of value – i.e. it makes no sense to choose between value and growth:
“But how, you will ask, does one decide what's ‘attractive’? In answering this question, most analysts feel they must choose between two approaches customarily thought to be in opposition: ‘value’ and ‘growth.’ Indeed, many investment professionals see any mixing of the two terms as a form of intellectual cross-dressing.
… In our opinion, the two approaches are joined at the hip: Growth is always a component in the calculation of value, constituting a variable whose importance can range from negligible to enormous and whose impact can be negative as well as positive.”
Great investment opportunities can be found in any market environment. We are opportunistic, and our flexible approach enables us to take advantage of whatever types of opportunities the market presents. We believe this is in the best interest of our clients, even if it may frustrate those who want to simplify the categorisation of our investment style.