
As at 30 September 2018, Naspers made up 18.2% of the JSE. Whether you are for or against the stock, adequate time needs to be devoted to considering the investment case as including or excluding it will have a big impact on your portfolio. Ruan Stander explains his approach to valuing the company.
At a price-to-earnings (PE) multiple of 35 on core headline earnings and a 3.4 multiple of accounting book value, Naspers appears expensive. However, when the company is viewed as a sum of parts, the picture becomes compelling. The share price of R3 000 is trading at a 44% discount to our estimated asset value of R5 400 per share, which we calculate by looking at the market value of listed assets like Chinese technology company Tencent, the estimated fair value of unlisted assets such as online classifieds business OLX, and cash realised on recent asset disposals. The margin of safety is so significant that a closing of the discount would create R1 trillion of value for shareholders, and halving the value of Tencent would still leave the company at a 10% discount to the sum of its parts.
Which perspective – PE or sum of the parts – is most relevant when considering an investment case for Naspers? Let’s start by addressing a pitfall of a sum-of-the-parts valuation. The sum is only as accurate as the parts.
If Naspers were trading at our estimated fair value (R5 400), the PE would be closer to 60. If Naspers consisted of excellent businesses growing earnings 5% faster than the stock market, these businesses would have to grow at this rate for 25 years to match the stock market’s PE ratio of 18 – a very optimistic assumption. However, this is not required as the profitability of some of Naspers’s businesses (Tencent’s online gaming business, MultiChoice South Africa and Russian online classifieds business Avito) is being offset by losses in various start-up businesses across the world.
A PE ratio is an indication of the price of a company relative to its earnings and calculated as the price of one share (share price) divided by the annual earnings that that share buys the owner (earnings per share).
A high ratio indicates that investors require the earnings to grow in the future and/or that the earnings are sustainable for a long period of time. A low ratio implies a business might not be around for a long time or could be in secular decline.
A theoretical manufacturing conglomerate with loss-makers across the world would not seem attractive since upfront capital spend should allow an average business to earn reasonable profits; losses would likely indicate an inferior product or production process. But for online businesses, this analogy does not translate well, since the barrier to entry is not capital spend, but rather network effects, and start-up losses are typically required to establish a network effect.
Network effects
Brian Arthur was one of the first academics to write about “network effects” or, in his words, “increasing returns”. The concepts and conclusions of his 1983 paper were so different from established equilibrium economics at the time that the paper was rejected by four top journals over a period of six years. Today, the empirical evidence is overwhelming, and indeed Arthur has been rewarded with various prizes and an influential role in the way information technology companies think about their businesses.
The theory maintains that if you have a business where value per user increases with the number of users, then it is very hard to predict market share when the market is young, but once your firm establishes a significant lead, market share tends to “lock in”, or persist. Facebook is a classic example where more users make the product more attractive to new users as they can connect to more people. Interestingly, the effect can be so strong that networks can exclude superior technologies, such as in the classic case study of VHS video cassettes winning against Betamax.
The implication for young network effect businesses is that it is advisable to focus on achieving a significant lead, even (especially?) at the expense of profitability, since a locked-in lead will ensure substantial profitability at a later stage. Examples of companies many of us use today, such as Google, Amazon and Facebook, took between four and nine years to reach profitability in search of a significant lead. Today, they enjoy very high returns with market positions that have held firm despite fierce competition. In all three cases, their competitors (eBay, Yahoo, Myspace/Friendster) were arguably too focused on showing profits early on and, as a consequence, ended up being overtaken and, with the exception of eBay, outcompeted into irrelevance.
Do Naspers’s loss-makers exhibit network effects?
Within the Naspers/Tencent stable, three significant business models stand out in the loss-maker column: online classifieds, online food delivery and online payments (especially WePay in Tencent). When evaluating these business models, network effects are clear, and one can point to case studies where the winner keeps on winning after incurring initial losses to establish a lead:
- In online classifieds, a buyer’s chance of finding what he is looking for increases with the number of sellers and vice versa.
- In online food delivery, the customer’s selection increases with the number of restaurants listed, and more users allow a restaurant to serve them effectively.
- Online payment requires adoption by many merchants and users to make it worthwhile.
There are, however, pitfalls when evaluating young network effect businesses:
- Substantial subsidies to customers can create an artificial market (i.e. user growth which disappears when subsidies are removed).
- New technologies could disrupt existing winners if they are not willing to adapt.
Does the theory translate into reality for the portfolio of companies Naspers owns?
One way of checking this is to see if the Naspers portfolio of ecommerce businesses shows increased returns while growing at a healthy rate. Graph 1 illustrates that the organic growth rate, as well as profitability, improved in the ecommerce segment for the year to March 2018, indicating increased returns and a low likelihood of unsustainable customer subsidies.
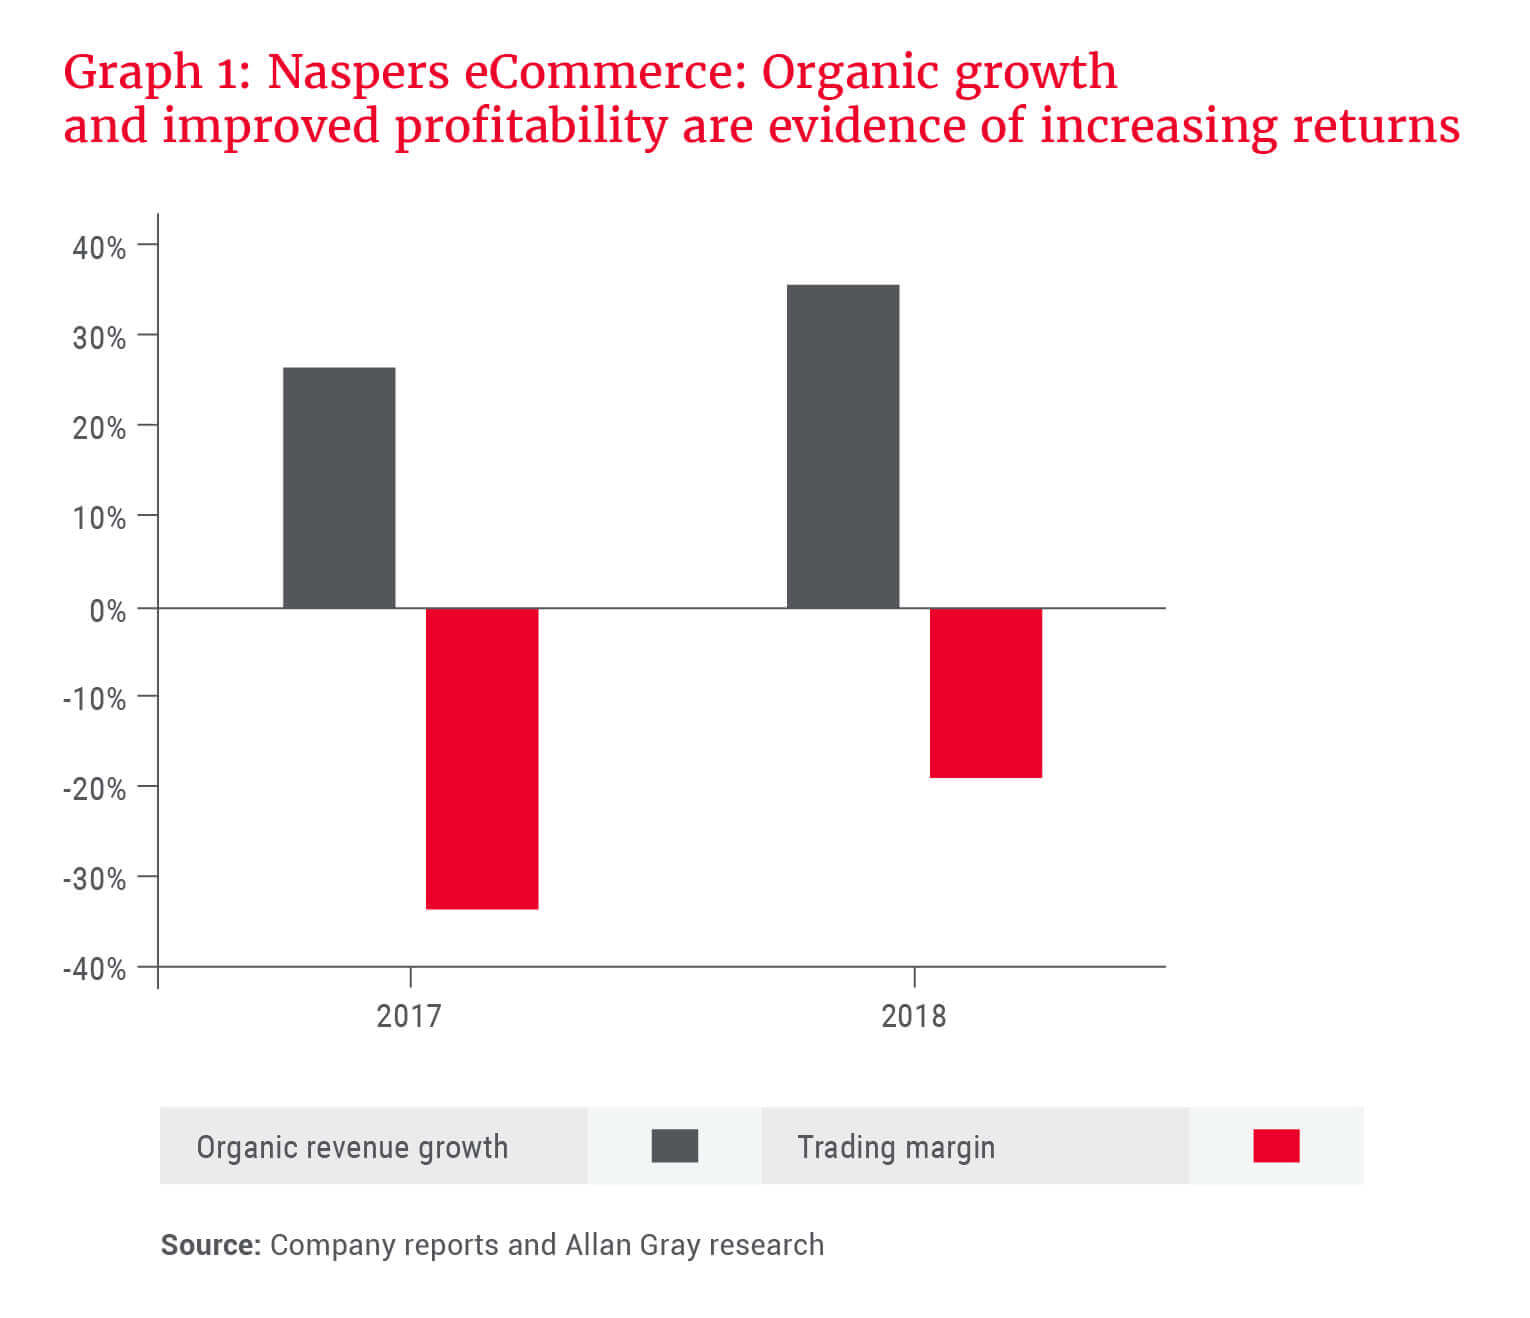
Given that Naspers’s online businesses should exhibit network effects and the evidence shown in Graph 1 indicates increasing returns, the next question is: What would earnings look like when the losses reverse to industry standard levels of profitability?
Naspers’s normalised earnings per share can be seen as two parts that sum to US$9.2 per share. This is made up of Naspers’s 31% share in Tencent, contributing US$7.6 to normalised earnings over the past 12 months, and Naspers’s ecommerce businesses at normal margins of 17% on expected 2019 revenue, contributing US$1.6 (the segment reduced earnings by US$1.4 in the year to March 2018).
If we consider that the current Naspers share price is US$210, US$43 of this comprises the value of MultiChoice that will be unbundled, and cash realised on recent asset sales. Therefore, one is paying around US$167 (US$210 - US$43) for a normalised earnings stream of US$9.2 or an 18 PE ratio (US$167/US$9.2).
The same PE multiple as the stock market seems very attractive for a group of businesses that converts its accounting earnings to cash (since they don’t need to spend on physical assets), should be hard to compete against given network effects, and is still growing at around 40% per year.
In addition, there is further upside that has not been included in the valuations above. Tencent’s payment business, which has achieved significant scale and market share with estimated annual transaction value of between US$1 trillion and US$11 trillion, is not currently charging users or merchants since it is competing for dominance with Alibaba. Assuming a 0.5% profit margin on the transaction value would create an additional earnings stream of between US$3 and US$33 per Naspers share. Tencent’s investment portfolio is worth around US$36 per Naspers share. Moreover, various Tencent businesses, such as online video and cloud services, are still in the loss-making phase and these losses have not been adjusted to a normal level of profits as we did with Naspers above.
Given the market multiple, strong growth and protection from competition due to network effects, Naspers offers attractive value to long-term investors.