Our long-term Allan Gray - Orbis Global Balanced Feeder strategy performance
The Allan Gray - Orbis Global Balanced Feeder AMETF is a new way for clients to access our Allan Gray - Orbis Global Balanced Feeder strategy.
While past performance is not a guarantee of future performance, given that the underlying Orbis funds and costs are identical, we believe it is useful to look at the history of the Allan Gray - Orbis Global Balanced Feeder Fund when making an assessment of the performance and risk measures of our Allan Gray - Orbis Global Balanced Feeder strategy over the long term.
To do this, we look at the Allan Gray - Orbis Global Balanced Feeder AMETF’s history from its inception on 11 December 2025, and for the periods before this, we use the track record of the Allan Gray - Orbis Global Balanced Feeder Fund.
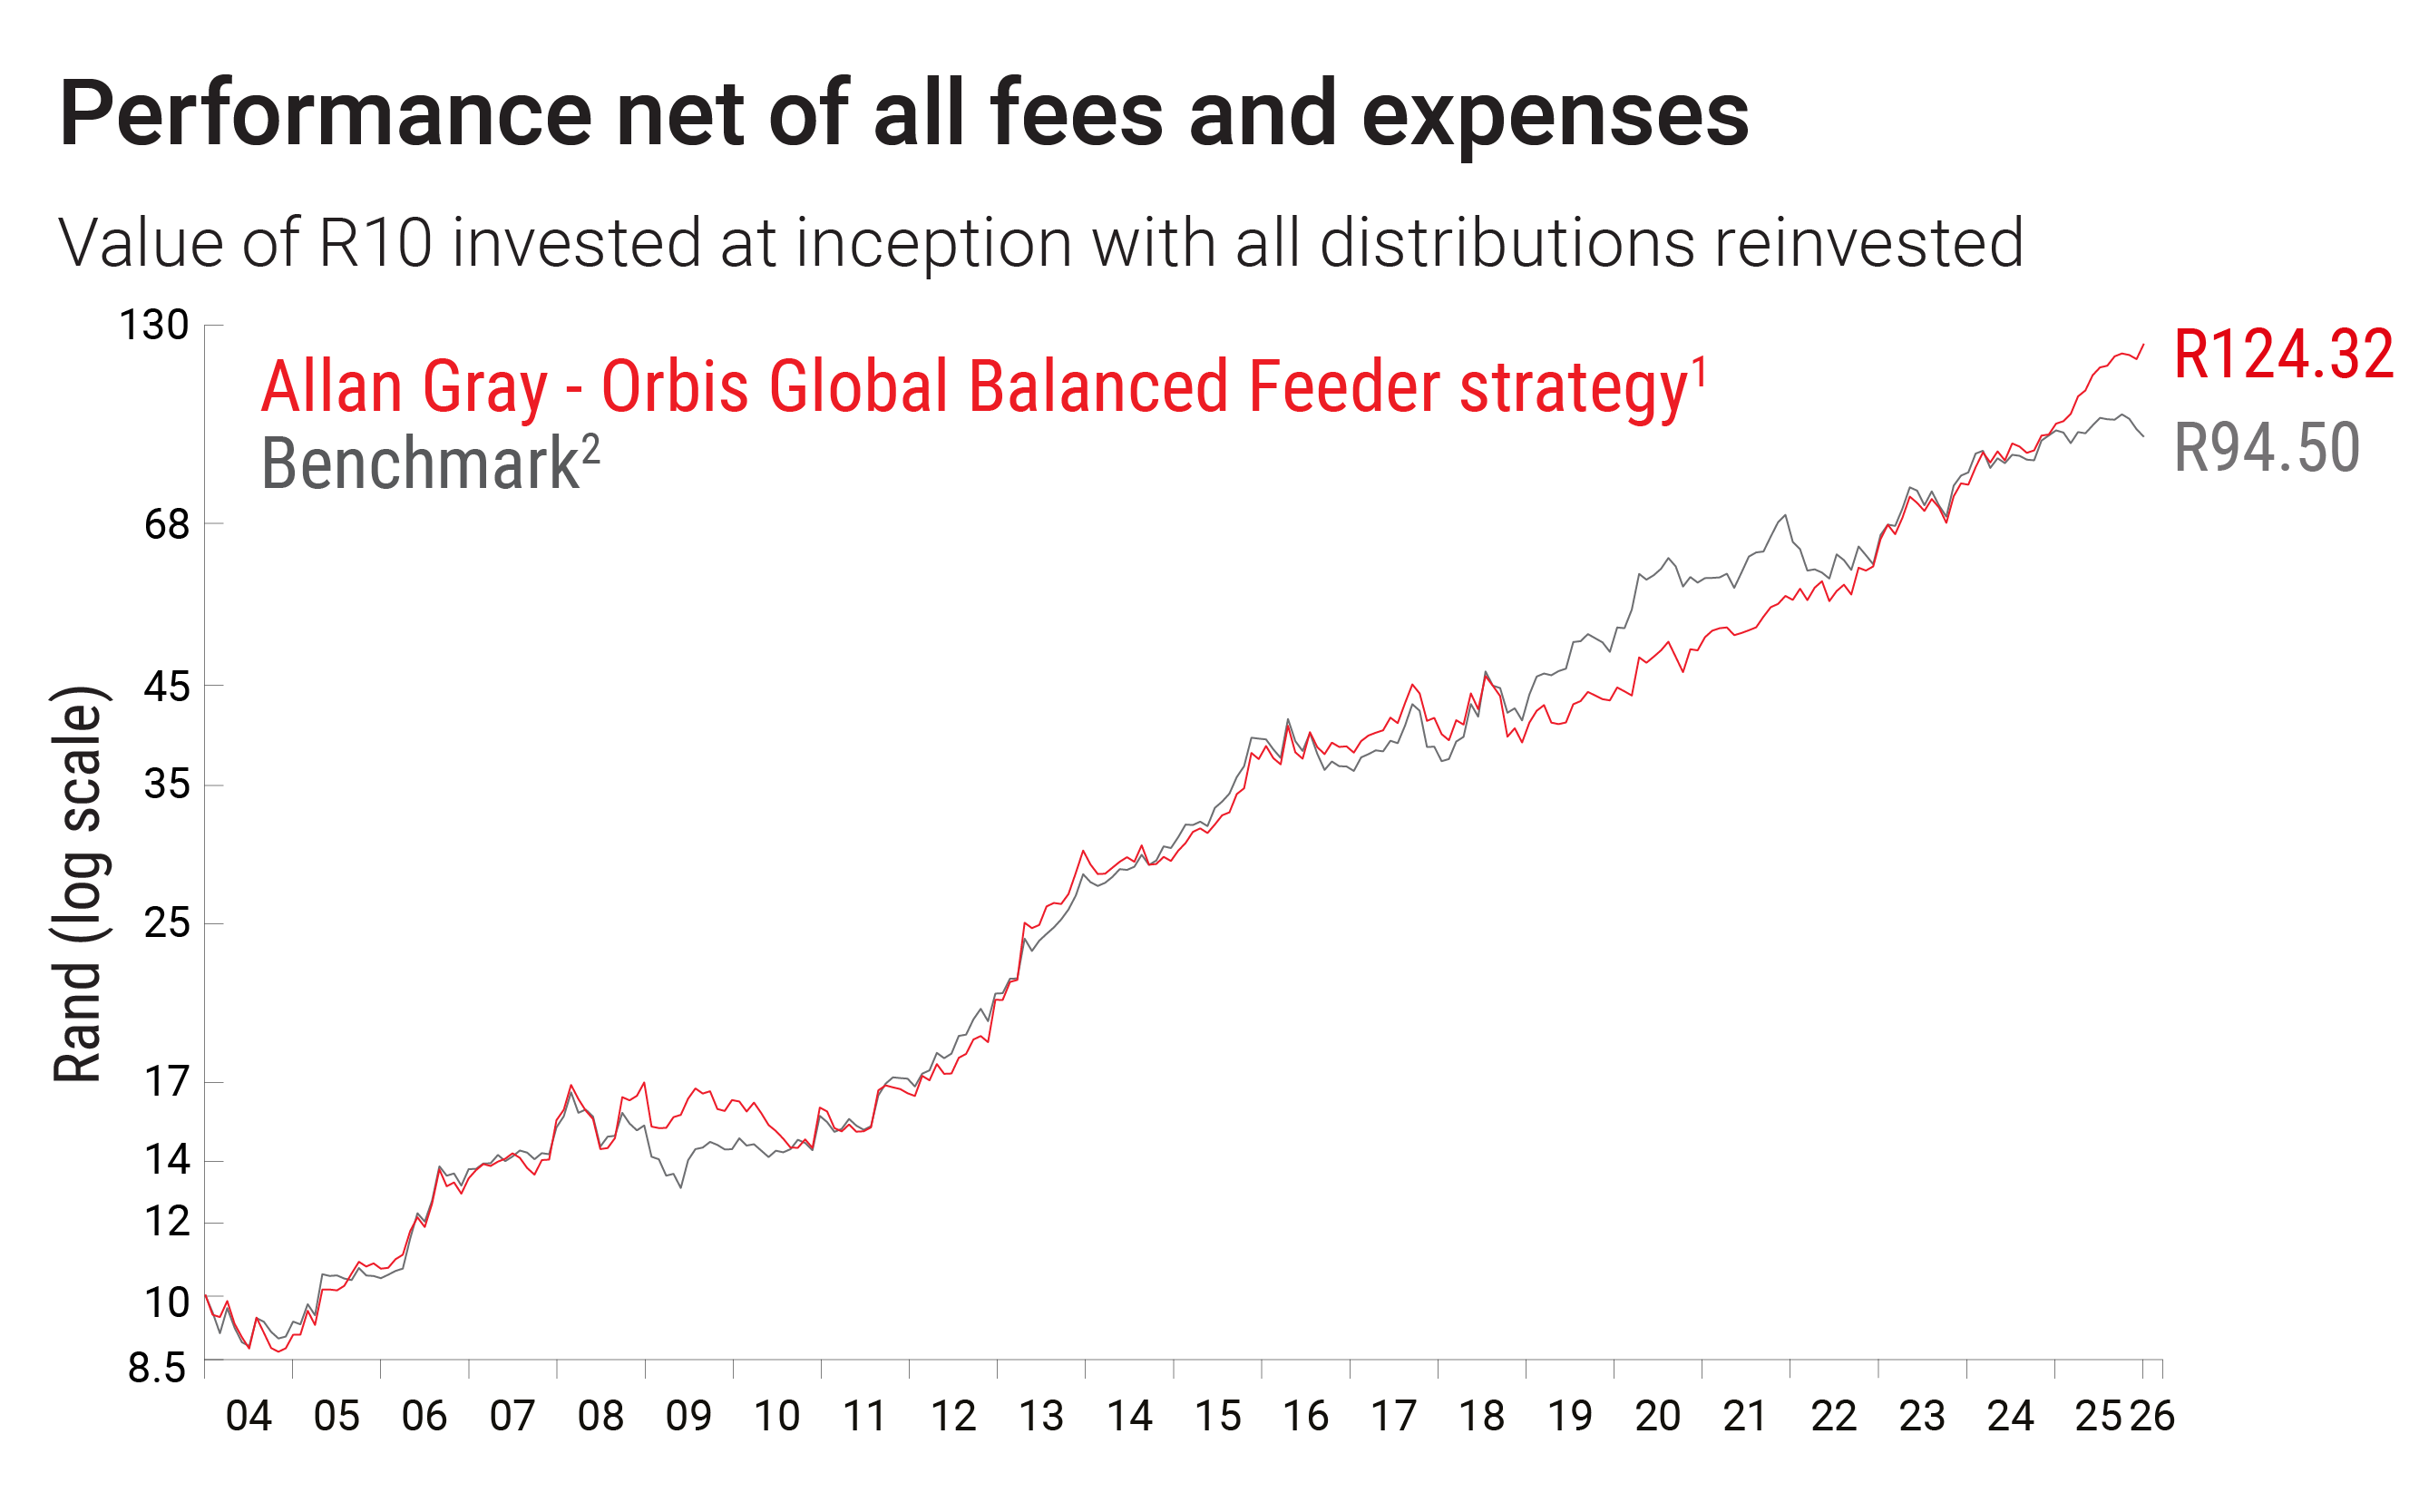
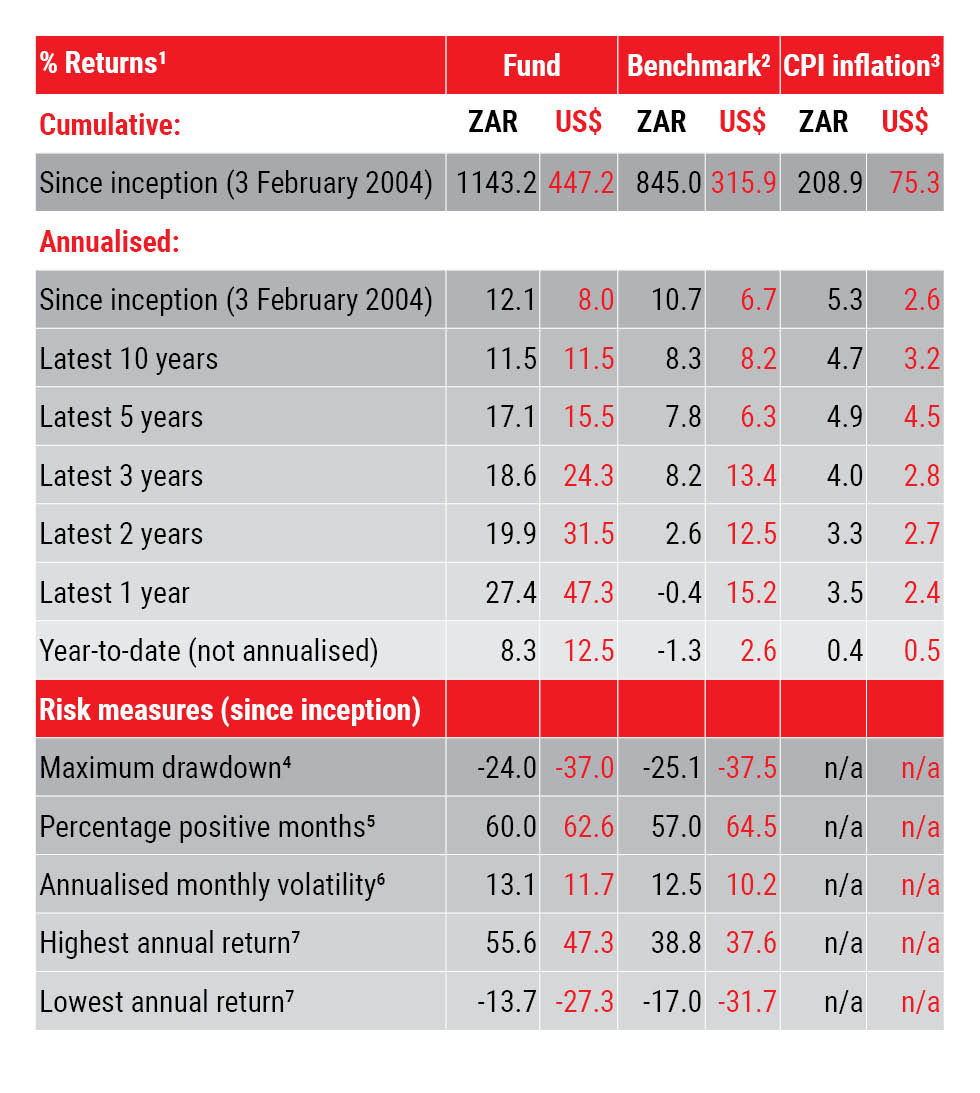
Performance of the Allan Gray - Orbis Global Balanced Feeder strategy net of all fees and expenses as at 28 February 2026:
1 The returns are for the Allan Gray - Orbis Global Balanced Feeder AMETF since inception (11 December 2025) and, before that, are those of the Allan Gray - Orbis Global Balanced Feeder Fund (inception date: 3 February 2004), which has the same underlying Orbis fund and costs as the Allan Gray - Orbis Global Balanced Feeder AMETF.
2 60% of the MSCI World Index with net dividends reinvested and 40% of the J.P. Morgan Global Government Bond Index (source: Bloomberg), performance as calculated by Allan Gray as at 28 February 2026. From 3 February 2004 to 31 May 2021, the benchmark of the Allan Gray - Orbis Global Balanced Feeder Fund was 60% of the FTSE World Index, including income, and 40% of the J.P. Morgan Global Government Bond Index.
3 This data reflects the latest available headline CPI inflation numbers for South Africa and the United States of America, as at 31 January 2026 (Source: Iress).
4 Maximum percentage decline over any period. The maximum rand drawdown occurred from 23 October 2008 to 14 October 2010 and maximum benchmark drawdown occurred from 23 October 2008 to 30 June 2009. Drawdown is calculated on the total return of the Fund/benchmark (i.e. including income).
5 The percentage of calendar months which produced a positive monthly return since inception.
6 The standard deviation of monthly return. This is a measure of how much an investment’s return varies from its average over time.
7 These are the highest or lowest consecutive 12-month returns since inception. This is a measure of how much the Fund and the benchmark returns have varied per rolling 12-month period. The Fund’s highest annual rand return occurred during the 12 months ended 31 December 2013 and the benchmark’s occurred during the 12 months ended 31 December 2013. The Fund’s lowest annual rand return occurred during the 12 months ended 31 October 2010 and the benchmark’s occurred during the 12 months ended 30 June 2009. All rolling 12-month figures for the Fund and the benchmark are available from our Client Service Centre on request.